By Guy Hagen
There are many different methods to optimize a combined PSA consideration across multiple properties, but using the wrong formula might cause expensive problems later.
You have just agreed upon a purchase price for a portfolio of revenue-producing properties. Now comes the tricky task of allotting that total portfolio price to each of the properties for the purposes of recording deeds, hopefully while not unduly increasing your tax exposure or causing yourself problems when are ready to sell. While your team has calculated a reasonable cap rate for the entire portfolio, the financials and valuations for the individual properties are probably not nearly so consistent! This article will demonstrate several different methods for apportioning the total portfolio price, and compare the relative strengths and weaknesses of each.
Just give me the recommendations!
If you want to skip the details and get right to the recommendations, here is a short summary of each portfolio price optimization method we review:
Method | Recommendation |
Straight line (equal value for all properties) | Terrible choice in almost every circumstance. |
By Square Footage | Never recommended; property size does not equate to margin and can generate unreasonable cap rates and problems with the assessor or future buyers |
By Unit Count | Never recommended; unit count does not equate to margin and can generate unrealistic cap rates and problems with the assessor or future buyers |
To Minimize Tax Exposure | Not recommended, may cause problems with the assessor and probably doesn’t produce tax savings worth the risk |
By Prior Assessment | Simple calculation, but prior assessment values may not reflect current NOI or replacement value, and can generate unrealistic cap rates |
By NOI | Produces consistent cap rates, but NOI may not be proportional to replacement costs and can cause problems with the assessor or future buyers |
By Mortgage Value | A realistic and consistent approach, but does not control for conflicts with prior assessed values |
Hybrid (Balancing Mortgage Value with Normalized Cap Rates) | An overall solid choice, but requires extra calculation steps |
You can skip to the end of this article for a downloadable spreadsheet you can use for comparing multiple optimization methods against your own portfolio.
Comparison Metrics, Inputs, Common Calculations
We will evaluate each of the optimization methods based on the following:
- Ease of calculation / availability of input data
- Combined impact on property taxes (note, the tax costs presented do not include potential savings realized from applying RealAdvice PairedExpert services).
- Impact on resale (for all tables in this article, we will highlight prices if they are more than 300% greater than prior assessed market values)
- Defensibility / exposure to challenge by assessors (for all tables in this article, we will highlight prices if they are below prior assessed values)
- Cap rate consistency (for all case study tables in this article, we will highlight cap rates if they fall beneath 3% or above 20%)
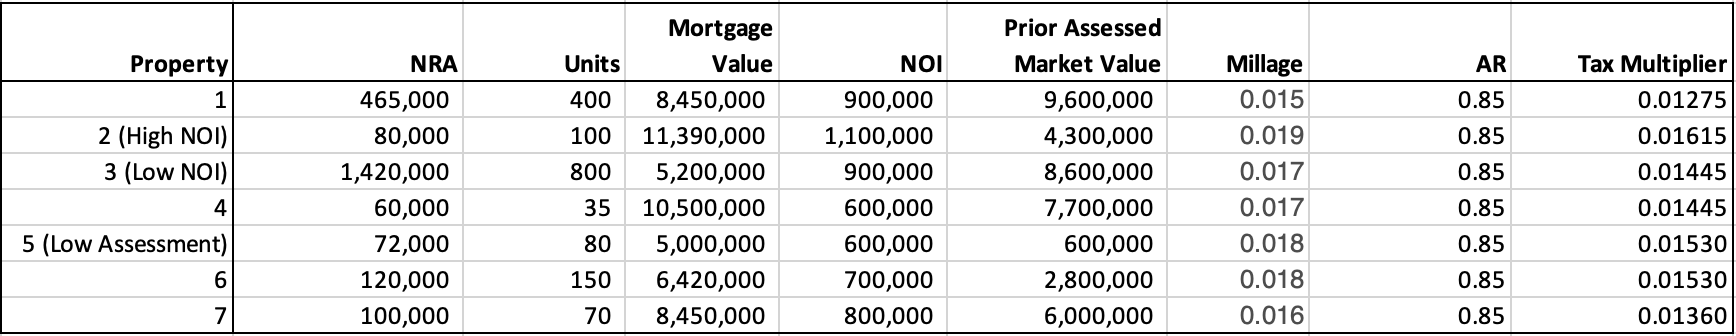
We will use the following case study data. The data are based on actual appraisal and tax data, although the records have been anonymized by adjusting the values. They are all multifamily properties in Florida, based on properties that transacted or were put on-market in 2023. They were located in counties around the state, and were not actually included together in any portfolio transaction. For purposes of this article, however, we are exploring them as if they transacted under a single PSA for $84,000,000.
As a final preparation, I introduce a calculation step which will be used several times in this article. “Proportioning” will refer to the process of:
- Column 1: Summing the total value of a spreadsheet column of some specified property values
- Column 2: Calculating the percentage contribution of each Column 1 value
- Column 3: Allocating all or some of the total portfolio price proportional to each Column 2 percentage
| Column 1 | Column 2 | Column 3 |
Value 1 | 2,000 | 20% | 20% x portfolio price target |
Value 2 | 5,000 | 50% | 50% x portfolio price target |
Value 3 | 3,000 | 30% | 30% x portfolio price target |
Column Total | 10,000 | 100% | 100% x portfolio price target |
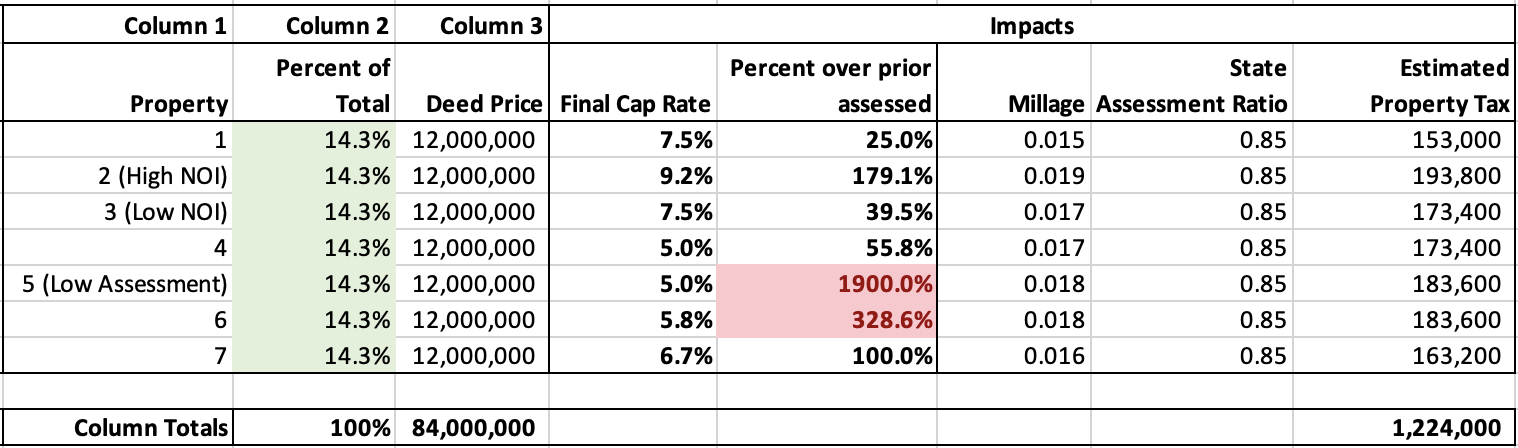
Straight Line Division
This is the simplest and most naïve method; performed by dividing the total portfolio price equally among all properties. Unfortunately, that simplicity comes with considerable risk; properties are never equal. The resulting calculations can produce very unrealistic cap rates; they can generate problems with the local assessors as the resulting recorded deeds fall well below prior recorded values; and it can potentially make individual properties difficult to re-sell as they could get saddled with a disproportionate share of future tax burden.
Optimization By Square Footage
This is an intuitive and simple proportioning method, but while it seems more sophisticated it unfortunately is not any safer than straight-line division. It is calculated by proportioning the purchase price based on individual property NRA (Net Rentable Area), or GBA (Gross Building Area). As shown in the following table, Column 1 displays each property’s NRA, and Column 3 holds the resulting proportional price. The resulting individual cap rates and comparisons to prior values show that this method would cause a lot of problems for the case study properties; this is because property size may have little actual relationship to insurable or replacement cost, debt burden, capital renovation costs, total tangible value, profitability, or taxable value. Resulting cap rates may be very unrealistic, and the individual deeds recorded on these prices could cause potential problems with assessors or future buyers.
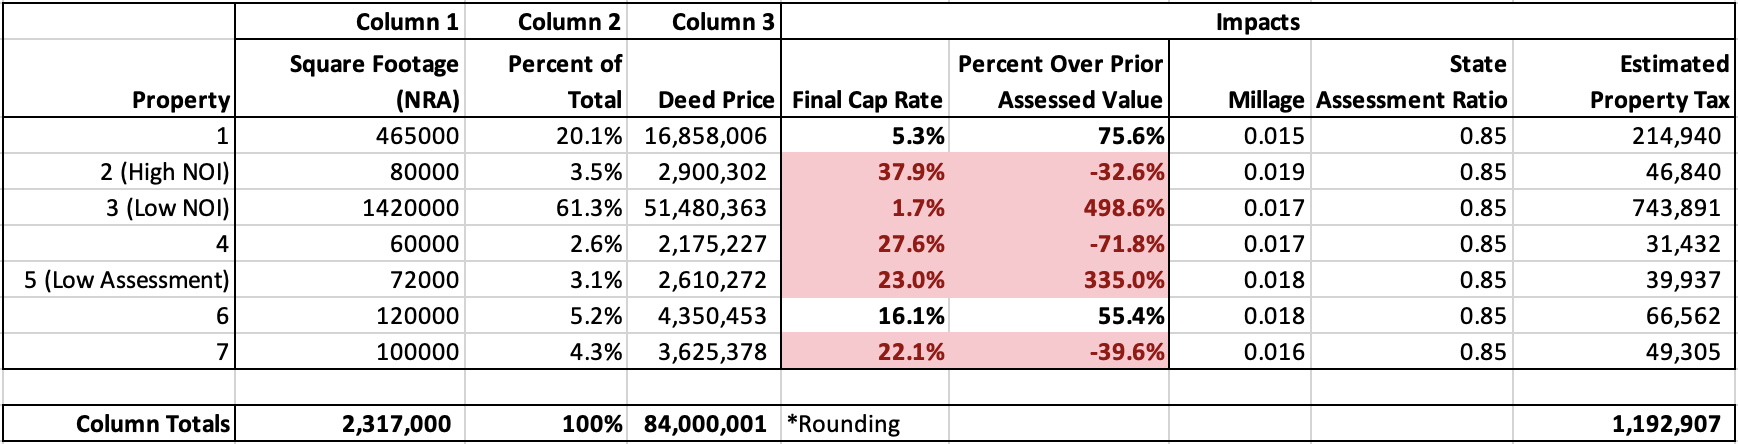
Note, proportioning under any method may result in minor rounding errors, especially if each property price is itself rounded. The minor “leftover” values may be allotted to any property without significant impact, so that the property prices sum to the portfolio PSA consideration.
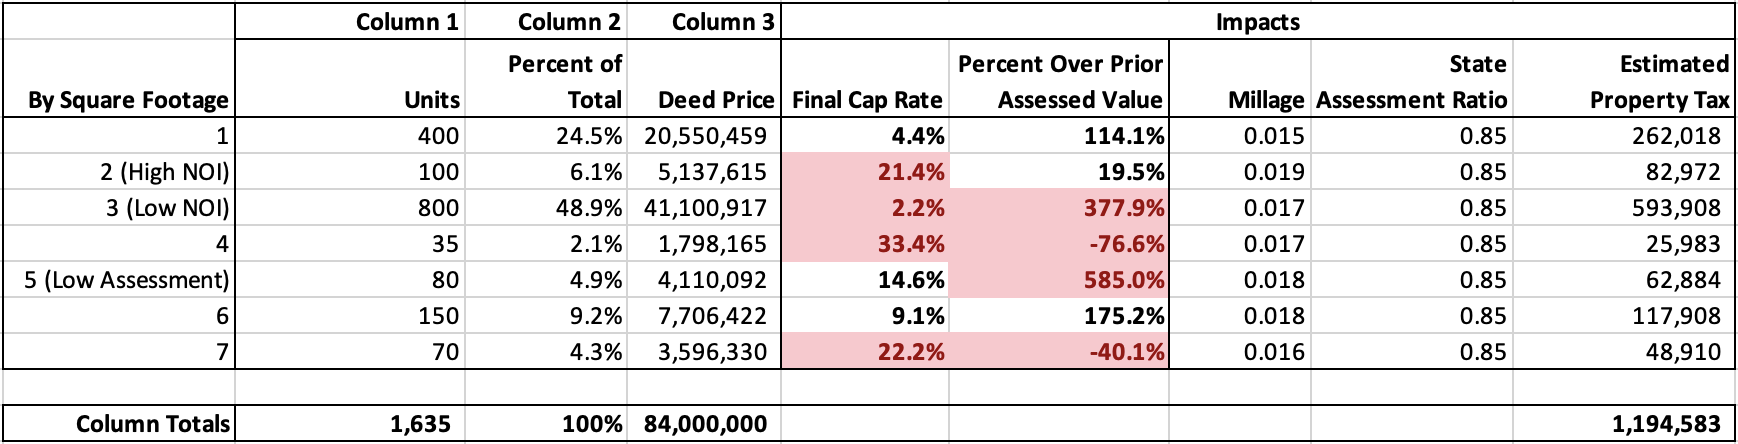
Optimization By Unit Count
This method is the same as the previous strategy, except it proportions portfolio price against the number of units (rooms, suites, offices) in each property (Column 1). It shares the same risks and problems as the Square Footage method, as unit count is unlikely to consistently correspond to profitability or any measure of real value across properties (particularly if the portfolio contains mixed use properties or different property types). Again, deeds recorded on prices derived by this might cause problems with the assessor or future buyers.
Optimization By Prior Assessed Value
Another reasonable optimization method would be to distribute the portfolio price based on the assessor’s prior assessed market value. A clear strength of this option is its simplicity, and the fact that tax records for each property should already have been made available as part of transaction due diligence.
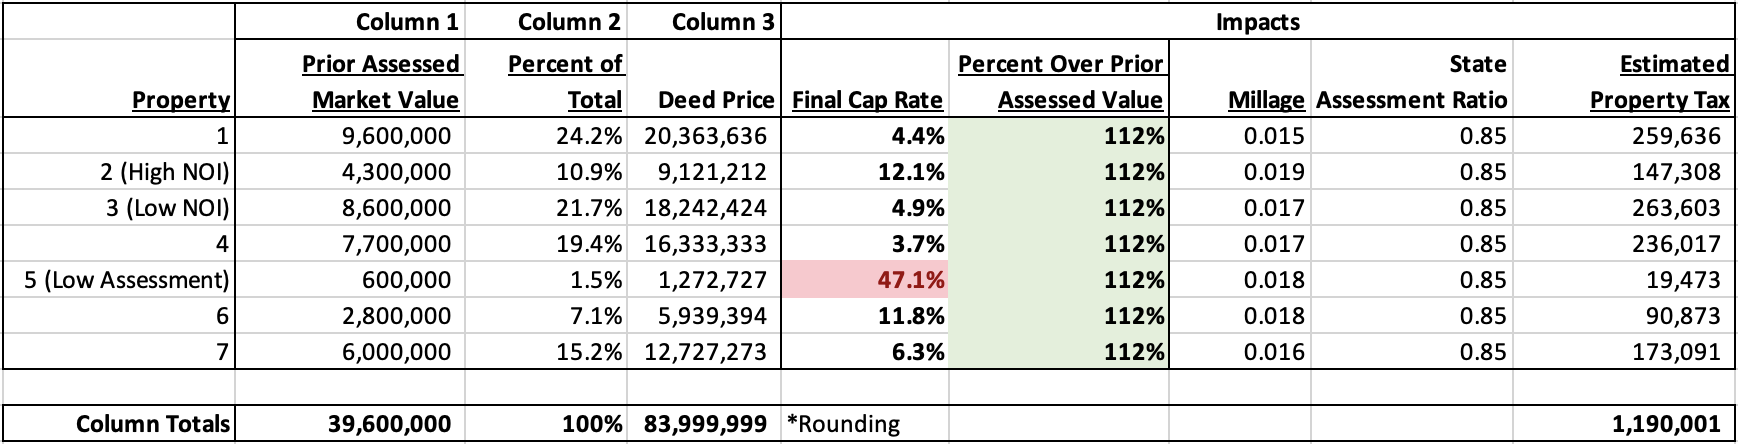
This method will probably not cause any problems with your assessors, as it will demonstrate a consistent increase in tax valuation for each recorded deed. Unfortunately, there’s a good chance that problems can arise elsewhere. The resulting cap rates may range widely, which potentially might be a problem for your lender, accountant or cost segregation specialist. In this case, Property 5 reveals a cap rate of over 47%! Ideally, cap rates should be consistent – in fact there are well-published methods for benchmarking current cap rates (Yield Rate Derivation, Built-Up Technique, Weighted Average Cost of Capital, Band of Investment / Debt & Equity, Debt Service Coverage Ratio, Market Extraction, and Market Surveys), and a sane and defensible set of financials probably will not generate an excessively wide spread of cap rates.
Although tax assessors have their own methodology for valuating real and tangible property, they often do not agree with valuations provided by professional MAI appraisers or assessments of a revenue-producing property’s current profitability without significant renovation. Property owners often have reason to disagree with assessors’ valuations and increases, which is why every U.S. county has a well established appeal process for challenging assessed values. Properties that have been over- or under-assessed in the past will continue to be so under this method.
Optimization To Minimize Tax Exposure
Property taxes are regularly one of the largest expenses in any financial forecast, many motivated property owners may be wondering if there is a way to optimize for the explicit purpose of minimizing property taxes; e.g. apportioning more recorded value to properties with lower relative tax burdens. With prior tax bills in hand, it is certainly possible to assign prices with this goal in mind, although it does require a few more calculation steps.
Step 1: We’ll provide a method that starts with prior assessed value, which will guarantee that each resulting deed price is less likely to be challenged by assessors. Reserve an initial price based on the prior assessed market value for each of the properties (Column A), and subtract the total from the total portfolio price as the available portfolio price.
Step 2: For Column B, we need to know each property’s “Tax Multiplier”:
Tax Multiplier = Most recent combined millage x State Assessment Ratio
This will reveal the full range of tax impact for each property; properties with higher Tax Multipliers pay more property tax per dollar of assessed market value than properties with lower Tax Multipliers.
Step 3: For Column 1, this method apportions more of the remaining portfolio price to the properties with the lower Tax Multipliers (and vice versa); to accomplish this we calculate an Inverted Tax Multiplier =
Adjusted Multiplier = (Largest Column 1 Tax Multiplier) – (Column 1 Tax Multiplier)
Step 4: For Column 3, we multiply the Column 2 values by the available portfolio price ($44,400,000) to obtain the additional price to be allotted to each property.
Step 5: for the final Column 4, we just add the Column A prior assessed values with the additional price values from Column 3.
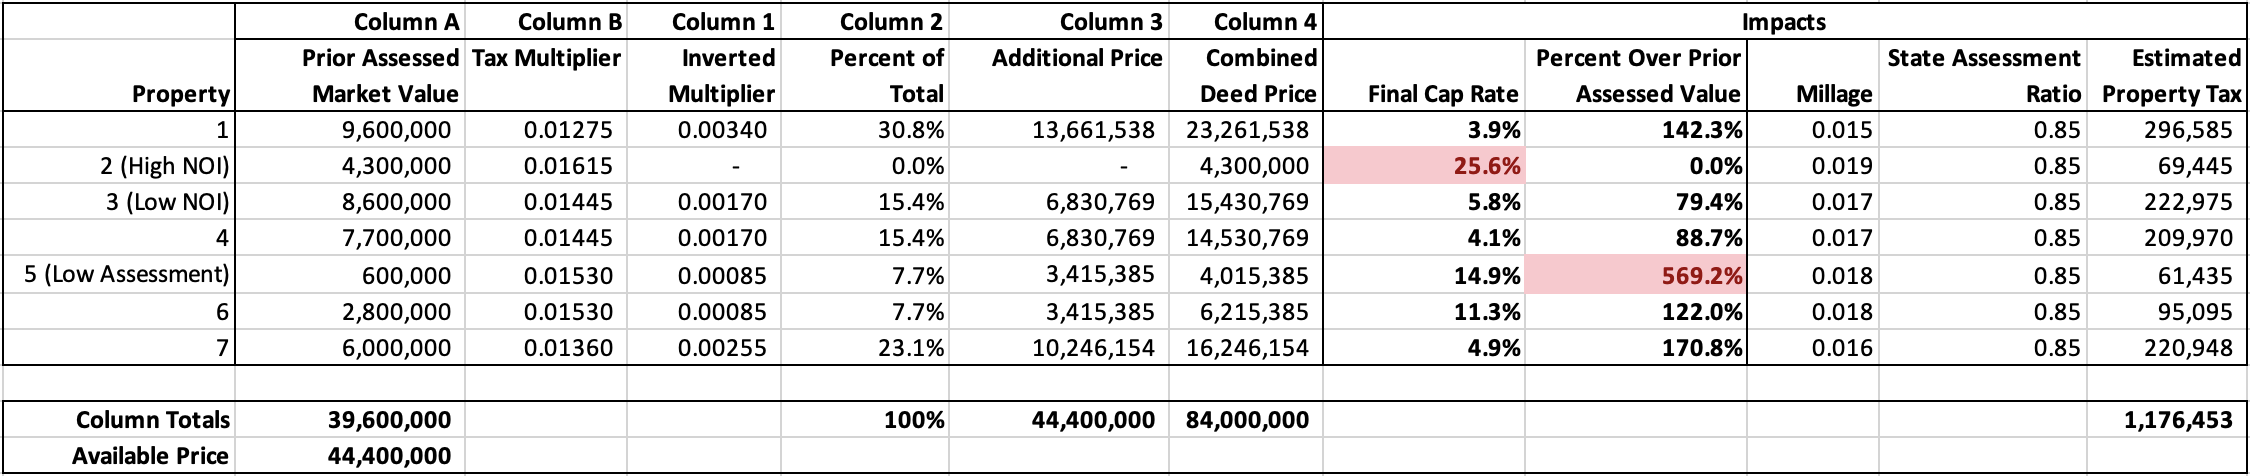
This method ensures that each property will be valued as much as, or greater than prior allocated market values, and proportions value to properties opposite to their relative property tax burden. Using these case studies (and ignoring millage rate growth for simplicity), this method generates an annual combined property tax expense of $1,176,453, which is a reduction of about $48,750 annually relative to allocating by prior assessment. This may seem attractive, but it is a very small savings relative to the overall tax bill (about 4.1%), and it comes with significant risks and downsides. Depending on individual property NOI, this method could generate unrealistic cap rates, because just like the “Optimization by Prior Assessed Value” method the resulting values may be disconnected from renovation costs, NOI corrections, occupancy shifts, or other measures of real value. Importantly, it will be difficult to defend the logic of these prices on a property-by-property basis, increasing the probability that the properties will not match sales comps, will invite challenge and higher valuations by county assessors, and result in increased legal and administrative costs supporting administrative actions and tax appeals that may easily overshadow any savings realized. We present this method only for educational purposes; RealAdvice does not recommend that buyers try to manipulate their tax assessments this way.
Method: Optimization By Net Operating Income
The next method we present for pricing properties is the Income Approach, and as buyer, you have likely generated detailed financial forecasts for each of your properties; alternately, a Direct Capitalization (DCAP) table was likely provided as part of any offering memorandum (OM). The Net Operating Income (or the Net Cash Flow) from the stabilized year provides a summary of the profitability and proportional revenue contribution of each property, and is also required for calculating cap rates. We can use the same proportioning method based upon each property’s estimated NOI to generate property pricing based upon a “business operations/ revenue” perspective that will likely appeal to your accountant.
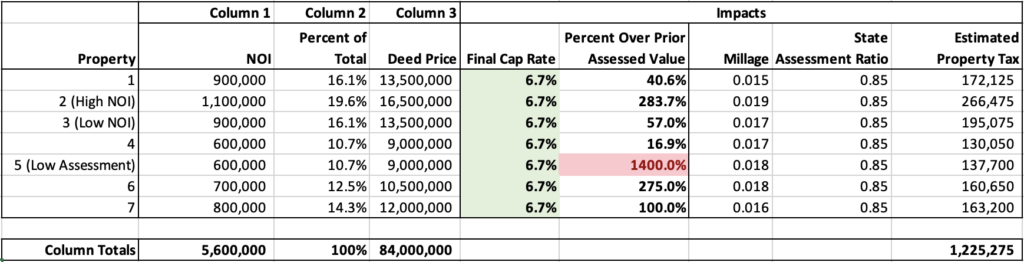
This method produces the wonderful result of equalizing (normalizing) all cap rates across the portfolio, which makes intuitive sense. This is especially useful if individual properties stand out as being very high- or very low-performers in terms of margin; it’s a fact of business that sometimes a buyer has to pick up a couple of “low cards” in order to get a “good hand!” Taken individually, “outlier” properties might generate cap rates that are too high or two low to transact normally; this method effectively averages out the entire portfolio’s profitability forecast so that the outliers are not apparent.
Under this optimization method, each property shares the same cap rate as the portfolio as a whole. However, by controlling for equal cap rates, we now find that other measurements become inconsistent – in some cases unworkably so. In this example, the new valuation for property 5 is nearly 14 times the prior assessed value – which might make this property difficult to resell in the future as any prospective buyer may inherit a disproportionately large tax burden. This method has some advantages, but still retains some of the problems and risks presented by other methods presented thus far.
Method: By Mortgage Value
If you are underwriting your transaction, you should have detailed mortgage appraisal values from your lender for each property in your transaction. Unlike prior appraised market values, the mortgage values should be tied loosely to forecasted market values, and as a result the cap rates for each property are likely to more accurately reflect on its relative financial contribution to the overall portfolio.
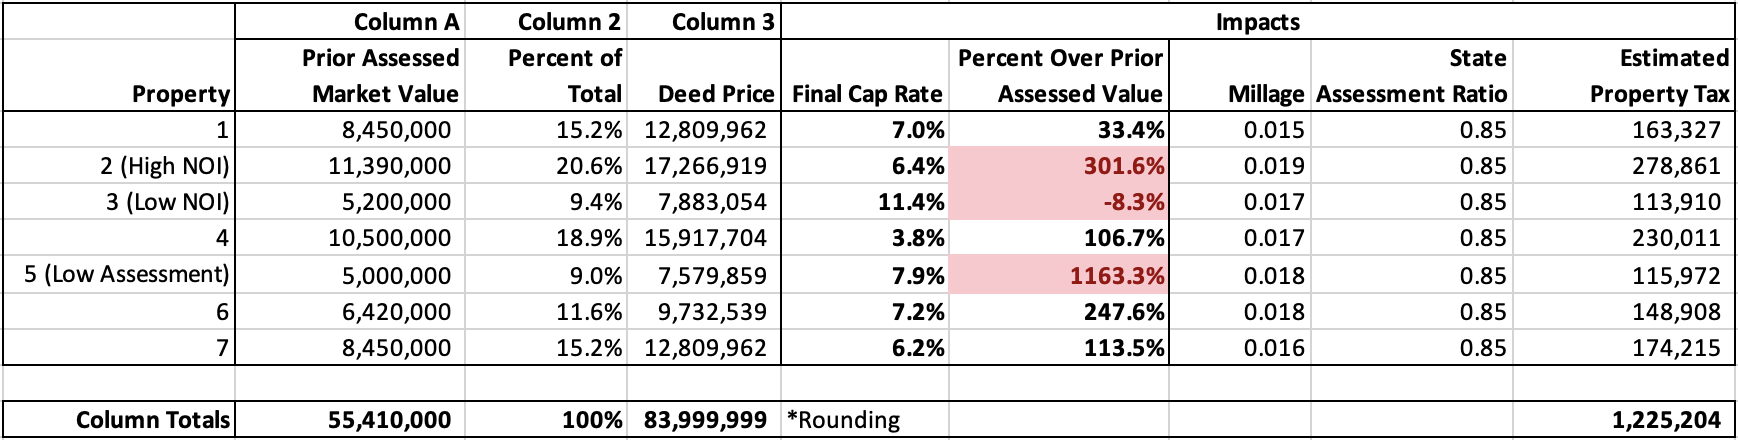
In practice, we find that pricing by mortgage value to be generally consistent and realistic, but not infallible. In the example above, the valuations for Property 3 is actually below the assessors’ prior market value; you can be certain that recording the deed at this price would result in a challenge by that county’s tax assessor.
Hybrid Optimization
As we’ve now observed from several of the prior optimization methods, normalizing or optimizing for any one value (cap rates, assessed value, reduced taxes, tangible value), can result in a certain level of unsupportable chaos in other key values. The apt metaphor is plugging one hole in the leaky dam, only to cause the other holes to leak more. Ideally, we should develop a method that attempts to take the best of all methods, and compromise between mostly-consistent cap rates and mostly-realistic deed prices. Necessarily, a hybrid method will be more complex than the other methods. The following example shows that by allotting parts of the total portfolio price in multiple steps, a combined purchase price optimization is possible that is reasonably robust and balanced.
Step 1. Allocate purchase price to each property equal to its mortgage value. Sum the column and subtract it from the total portfolio price as the “available portfolio price” (Column A).
Step 2. Record each property’s NOI as Column B.
Step 3. For Column 1, calculate each property’s partial cap rate based on the NOI (Column B) and mortgage value (Column A).
Step 4: For Columns 2 and 3, proportion each property based on Column 1.
Step 5: Calculate the “combined deed price” in Column 4 by adding together Column A (Prior Assessed Market Value) and Column 3 (Additional Price).
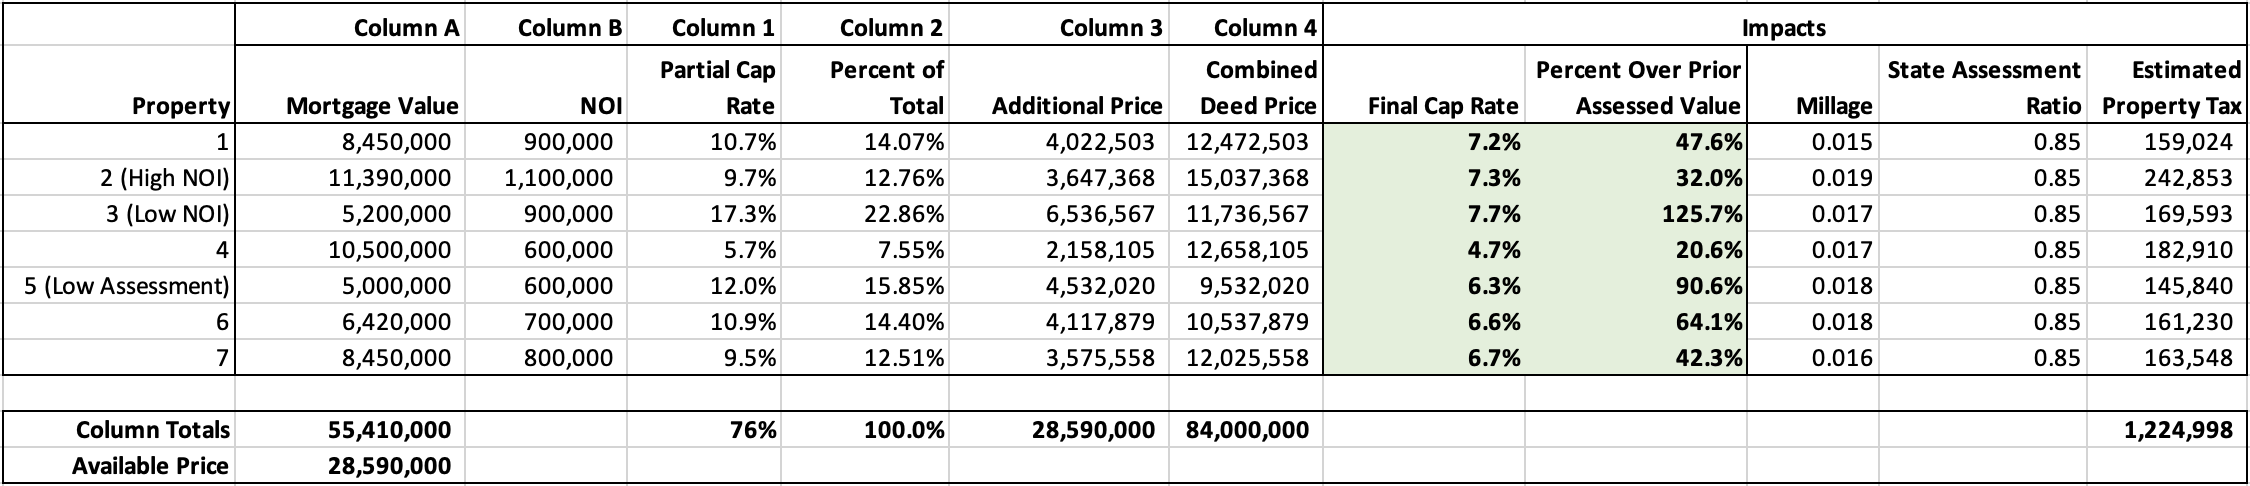
As shown above, this produces relatively defensible metrics without significantly increasing combined annual tax expense. While not being identical, the cap rate spread is greatly reduced. Under this method, properties that were previously under- or over-assessed are still likely to show some correction, but these corrections are justified to correspond to current market trends, depreciation, and renovation requirements.
While it is instinctual to think of an “average cap rate” across an entire transaction portfolio, it must be acknowledged that in reality every income-producing property is unique, and will demonstrate very different levels of real value, depreciation, and profitability. Some properties will be very attractive and profitable, and frankly some may be low-performing properties that had to be acquired as part of the “package deal”. When this is acknowledged, it is more realistic to have portfolio price distributions that reveal a range of cap rates and real property values, while still centering on the overall transaction cap rate.
Observations
The optimization methods we’ve presented are just the “tip of the iceberg.” There are many additional strategies that can be devised, for normalizing or optimizing for different factors, to include actual appraised real property values, or to support the proper allocation of taxable and nontaxable value as utilized by RealAdvice services.
The specific method a buyer chooses to “parcel out” prices within a combined portfolio consideration can generate strategic benefits, but potentially also create downstream risks and costs. Incautious optimization can invite challenge by property appraisers, or create a situation where one or more properties become overvalued and difficult to resell. Identify your objectives before optimizing, work closely with your accountants, and consult your appraisers – and you should always be confident that your portfolio price optimization is sane, defensible, and profitable.
Free Optimization Workbook
We’ve prepared these optimization methods in a free excel spreadsheet so you can explore different pricing strategies on your own portfolio.
By using this website, user acknowledges and agrees that this workbook is provided for educational purposes only and is not legal or tax advice or any form of client representation. RealAdvice shall not be liable for any direct, indirect or consequential loss or damage as a result of relying on this educational workbook. Any past performance, projection, forecast or simulation of results is not necessarily indicative of the future or likely performance. Estimates of performance are based on hypothetical assumptions that may not be realized. RealAdvice is not responsible for your use of the information contained in or linked from this web page. RealAdvice assumes no responsibility or liability for any errors or omissions in the content of this site. The information contained in this site is provided with no guarantees of completeness, accuracy, usefulness or timeliness.